SimIDE
Real-time C++ debugging & interactive DSA algorithm simulation directly in VS Code. Real C++17 execution over native GDB/LLDB via Debug Adapter Protocol (DAP), spring-damper physics canvas (d3-force), dynamic pointer discovery, and CRT boundary protection.
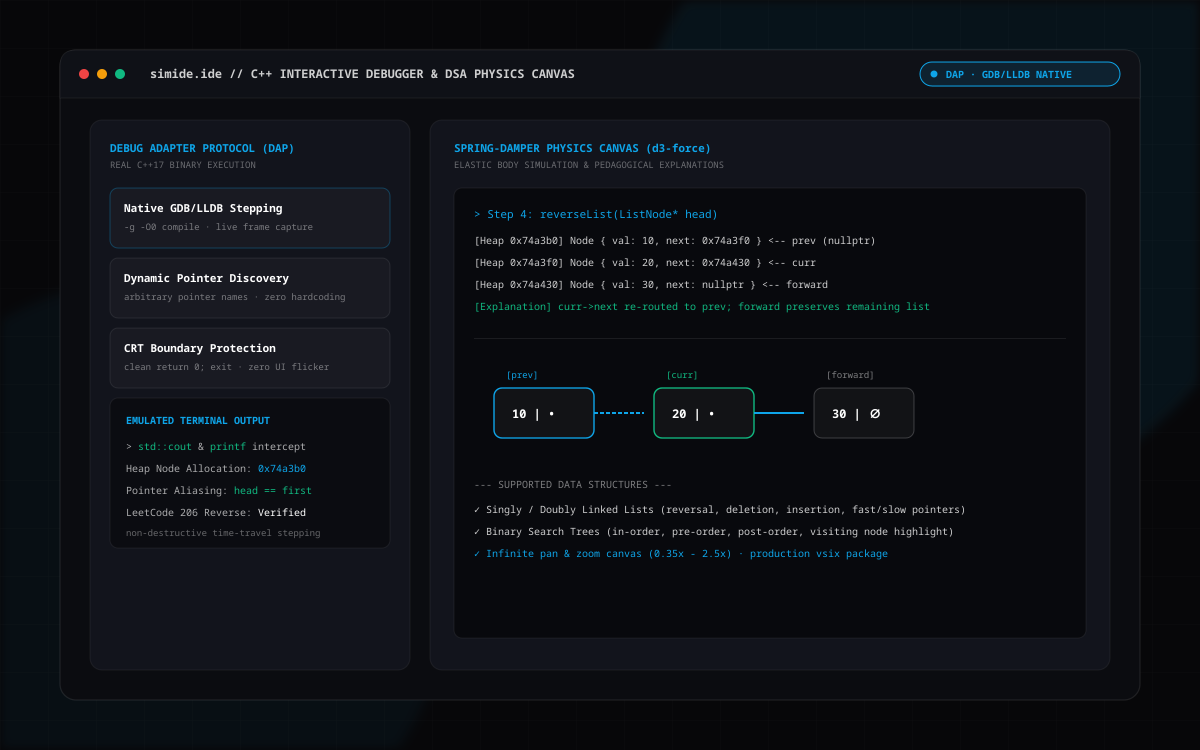
Mastering memory management and pointer-based data structures in C++ is notoriously difficult: raw hexadecimal addresses in debugger variable panes (e.
Mastering memory management and pointer-based data structures in C++ is notoriously difficult: raw hexadecimal addresses in debugger variable panes (e.g. 0x74a3b0) are impossible to visualize as connected graphs, while disconnected browser visualizers disconnect learners from real language servers, build tasks, and compiler diagnostics.
Built genuine debugger orchestration on the Debug Adapter Protocol (DAP): compiles native C++17 with debug flags (-g -O0), coordinates with GDB/LLDB across process boundaries, and captures live heap and stack state upon every step.
Engineered dynamic pointer discovery via source regex and line thresholds: automatically identifies and tracks pointer movements across function calls (printList, reverseList) without hardcoding variable names.
Developed a spring-damper physics canvas (integrated with d3-force): renders interactive bodies connected by elastic springs with Excalidraw-style pan/zoom (0.35x–2.5x), live pointer aliasing alerts, and pedagogical plain-English explanations.
Implemented detached allocation tracking & CRT boundary protection: tracks newly allocated heap nodes before pointer linkage and cleanly detects return 0 / C-runtime exit routines without visual diagram flickering.